Excellent code is just a part of custom software development. Success will depend on how well your team divides its time and efforts between development, quality assurance, design, and project management. Lack of alignment in this case may result in delayed launches, excessive budgets, and poor user experience.
Whether you are developing an MVP of a web application in a startup or scaling enterprise backend systems, it is always important to allocate the software development effort correctly. However, most companies find it challenging to have an optimal dev QA design PM ratio or how they should allocate resources within the software project as time progresses.
This guide opens the industry data, discusses best practices, and assists you in customizing your own effort mix in software teams.
Balancing Dev, QA, Design & PM: Finding the Right Effort Mix
Time is limited and resources are scarce in every software project. What best separates those time blocks between code writing, user interface design, testing, and process management? Rules of thumb are applied in practice to allocate effort roughly. One of the rules of thumb is that development (coding) consumes the most significant portion (typically 40-60%), QA/testing follows (approximately 20-30%), and then the rest is divisible between design/UI (UX) and project management/planning(each of them perhaps 10-20%). These rough percentages are just beginning points; they vary according to project type, team composition, and methodology.
| Role | Typical Effort % (rule-of-thumb) | Notes/ Source Examples |
| Development (Coding) | ~40–60% | Majority of effort; build & unit-test features. |
| QA / Testing | ~20–30% (can be higher with manual work) | E.g. 1 tester per 3–5 devs*. |
| Design (UX / UI) | ~10–15% | Often ~1 designer per 10 devs ([What Should the Designer-to-Developer Ratio Be and How to Scale? |
| Project Mgmt / Planning | ~10–20% | Includes requirements, planning, coordination**. |
Table: Example effort-allocation ranges for a typical software project. These are industry benchmarks and “rules of thumb” – actual projects may vary. Data from surveys and expert advice.
There is logic behind these numbers. By definition, development will likely absorb most of the effort: writing, reviewing, and unit-testing code. QA and testing encompass integration testing, bug fixing, and, in many cases, system/regression test suites. (The QA time is usually low on that 20-30% scale when the process is rather mature or heavily automated, and much higher in more manual or regulated projects.) Design/UI work (UX, visual design, prototyping) changes depending on the degree of design finesse and user research required in a product. And project management (req analysis, sprint planning, coord, docs, reviews) is usually recommended to be something like 15-20% of effort – even high-performing teams up-front plan about 20% of project time to avoid the trouble later.
Redefine Your Project with Our Development Teams
Fuel Your Projects with Tailored Software Development Expertise
Get Your Development TeamFor example, Nielsen Norman Group discovered that 50% of teams include approximately 1 UX designer to 10 developers. Practically speaking, if you have 10 software engineers, you may begin with 1-2 UX/designers and 2-3 QA/testers. On the same note, most practitioners start by having a tester per 3-4 developers. This is about 20-25% effort on testing in our table above. Of course, as one expert cautions, these are suggestions, not prescriptions: some projects will require a tester for each developer, others can have testers assigned to several developers.
On the whole, these allocation standards have been reinforced by different sources. Industry-cost models such as COCOMO II indicate that in waterfall projects, at least 5-15% of the effort is spent on requirements analysis and possibly another 15-20% on design before coding. That means that coding and unit testing may then be of the order of 50-70% overall, with the remainder to be done by QA and validation. In the meantime, PMI recommendations and the project statistics suggest that approximately 20% of the time should be devoted to planning and management. Thus, the side-of-the-envelope picture of half plus coding, 20-30% testing, ~10% design, ~15% management, fits pretty well with several sources.
For additional prioritization strategies, read A Guide to Master Prioritization for Project Management Tools and MoSCoW Prioritization: Essential Guide for Project Management.
Why Those Ratios? The Rationale
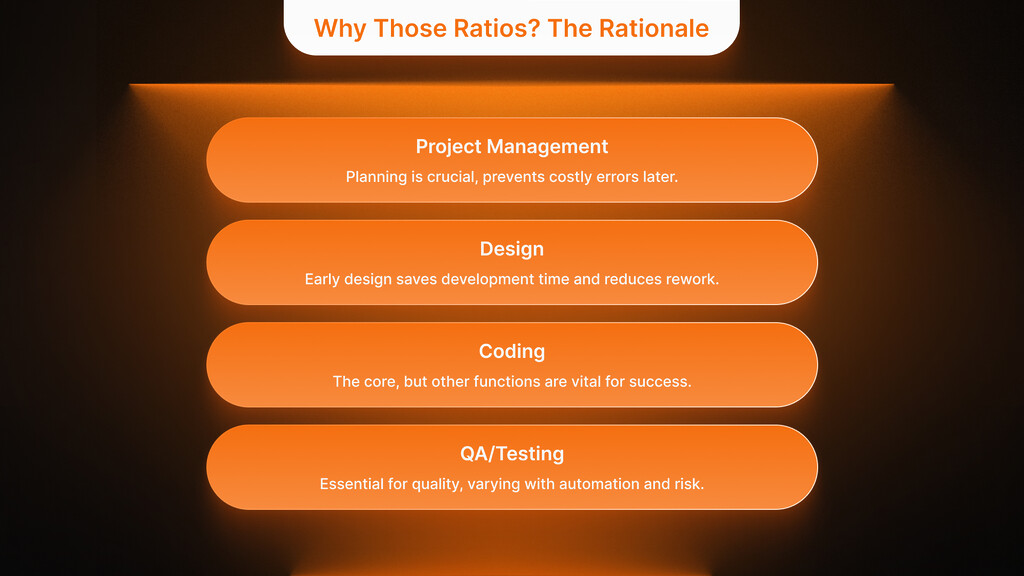
Why do such roles disintegrate in this manner? A portion of it is in-house roles: writing code is time-consuming. However, it is not only this. The earlier the good design/UX work is done, the easier development will be (e.g., specs will be more precise), but it requires initial investment. It is common to find that many organizations are willing to allow ~10% of effort on design, which is sufficient to create user flows, wireframes, or prototypes, because it is more than the payoff of the reduced rework in the future. Literature (Nielsen Norman Group, etc.) indicates that typical designer-developer staffing is approximately 1:10, and design effort will typically be 10% of coding effort. Depending on the user orientation of your product (e.g., a consumer app, a UI with lots of complexity), you may ratchet up the design effort (some tech companies have 1:5 designers per dev, i.e., about 15-20% design effort. High backend or data projects, on the other hand, may do with a lower design ratio.
Boost Engagement Through Tailored UX/UI Design
Designing Impactful Digital Experiences That Foster Connection and Increase Sales
Discover UI/UX DesignLikewise, QA/testing time is also a factor of process maturity and risk. An increased amount of automated testing (unit and integration tests that developers write) will reduce the QA effort; excessive manual or regulatory testing may increase it. There are some practical guidelines, such as plenty of testing time, e.g., in the classic work on software inspection by Gilb, it is pointed out that testing may take between 10-60% of the coding effort, depending on the rigor (or inefficiency) of your process. In our rule-of-thumb table, we have assumed ~25% in testing, but understand that it can vary. Agile enthusiasts tend to point out that it is designed to be tested continuously: one example of an agile team: squads of ~4 devs, 1 QA (plus product/UX) – already ~20% QA by manpower, plus the developers have their own unit tests.
The overhead of project management and planning (10-2%) represents everything that is not coding that keeps a project on track: gathering requirements, architecture, sprint planning, meetings, status reporting, risk management, etc. According to best practices (PMI, project-management research), do not shortchange planning time; elite project teams spend about 20% of calendar time on planning activities. It is hoped that it is worth it to spend time now to save 100x later correcting the wrongly aligned code! (As an anecdote, PM guru Andy Crowe discovered that the elite “Alpha” PMs spend almost twice as much time planning as average PMs.)
In brief: the lion’s share of the work goes to the coding as it creates the product, but you cannot afford to neglect the other functions. Good design translates to quality and easy-to-use software. Full-scale QA/testing precludes costly post-release bugs (note that Gilb discovered bad QA may actually increase coding time because of corrective work). And there has to be planning/coordination to ensure the entire train is in motion. The above ratios turn out to be a practical compromise that has been workable for many teams.
How Ratios Change with Scale or Complexity
These cannot be permanent percentages. The effort mix may vary as projects increase or alter in scope. Overhead is usually greater in bigger and more complicated projects. For example, a massive enterprise project can employ dozens of developers – the overhead of communication and integration implies a bigger cut of project management (more meetings, reviews, cross-team coordination). On the same note, intensively complicated or safety-sensitive projects also require additional QA. Practitioners observe that the more complex a system is, the more specialized testers it needs to make the optimum one QA per two developers instead of one per four. At one custom-software company, they maintain a ratio of dev:test of about 3:1, and on really tricky features, they narrow it to 2:1.)
Design/UX ratios also change in scale. Historically, many huge tech companies (Google, Facebook, etc.) have had a larger number of designers: internal reports have sometimes indicated ratios of 1:5 or even 1:8. This shows a focus on user experience. Conversely, smaller startups or backend-heavy projects might be lean on UX (maybe 1:20). The trick is the context: a b2b API may require minimal visible UI, but a consumer app requires a well-polished design.
Project overhead is likely to increase as a project expands. Brooks Law is a reminder that people are not free. On the contrary, they come with communication lines. The greater the developers, the greater the integration points and decisions, so your project management may have to increase proportionately. One heuristic: in small groups (<8 or so people), you can manage with a loose-sketch plan and a single individual doing multiple roles (e.g., PM, architect, QA lead, etc.); an enterprise group (20+ engineers) can be expected to have dedicated PMs, architects, QA leads, etc. As such, the PM percentage may remain between 10-20%, but the number of people increases.
In summary, scaling effects: The larger or more complex something is, the more it requires QA and PM. High-reliability projects (e.g., medical devices, aerospace) typically spend 30-40% on QA/testing. Heavy UX projects or projects with many user roles consume 15-20% of the project on design. Smaller, less-complex teams may be able to creep down to dev ~70, QA ~10 (assuming the devs act as testers). Never take the ratios and scale down: “You can not scale down the ratios and expect it to work: If you double your dev headcount, you probably can not afford the same 2:1 dev:test rate, you will have to hire more testers and perhaps a lead QA/architect who can coordinate them.”
Explore this topic further in Master Project Complexity in Software Development and
Dedicated Development Teams – Understanding Their Purpose and Functionality.
Agile vs. Waterfall: Adapting the Mix
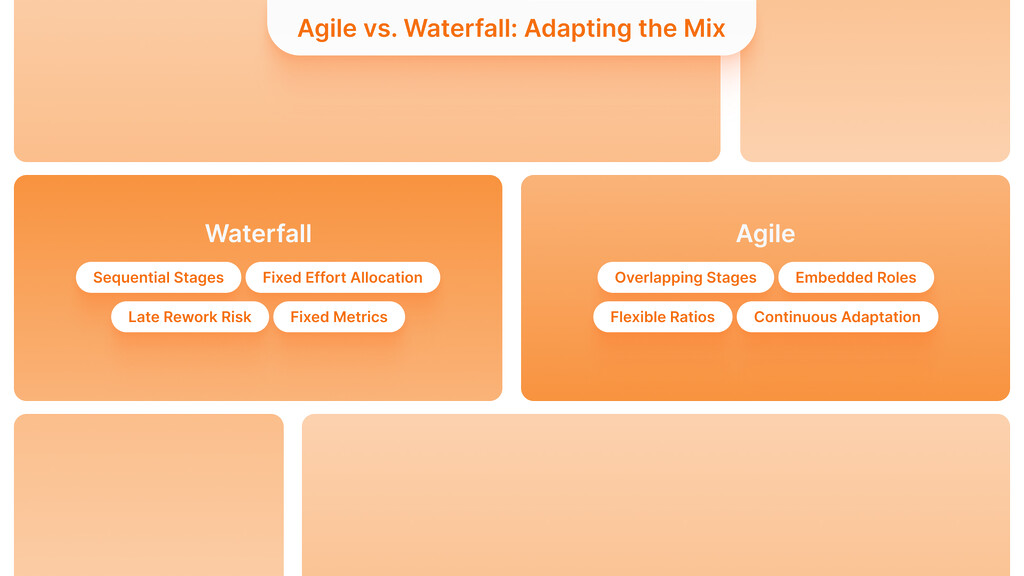
The way you work may transform the logistics of this distribution. In a typical waterfall project, a project is done in stages: requirements and design (usually 15-30% of efforts combined), implementation, and testing. In that model you may formally make 15% of analysis, 15% of detailed design, ~50% of code and 20% of QA/test (In fact, benchmarking studies by Reifer et al. suggest requirements may be ~7% effort, design may be ~17%, leaving ~75% of coding/testing in a typical waterfall). The latter’s disadvantage is that if you guess wrongly at the beginning, you suffer late rework.
In Agile development (Scrum/Kanban, etc.), these stages overlap and repeat. In every sprint, requirements, design, coding, and testing occur. This implies that you may not literally count the design phase is 15%. Instead, you keep putting some amount of effort per sprint to refinement and UX: perhaps there is 1 UX person in the team, who does ~40% of each sprint in the design work, and the rest in code. Likewise, testers are embedded from the beginning; hence, QA is decentralized (and is frequently performed by developers through TDD or pairwise testing).
Nevertheless, there is still a good rule that many Agile teams have approximately the same headcount ratios as presented above. For example, a particular study identified 4 devs + 1 UX + 1 product owner + 1 QA squad. That would be ~33% dev (headcount), ~17% UX, and ~17% QA, which should be roughly our table ratios. You may reserve some of every sprint (~ 10-20%) to backlog grooming and design work (that becomes your design/PM time), and spend most on feature development and testing.
Responsiveness is one of the practical distinctions in Agile. Should a sprint bring up too many bugs, an agile team may change its priorities to add more QA effort in the next sprint (or divert dev effort to writing tests) instead of waiting for a test phase. Burndown charts and velocity are usually used by Agile teams to monitor whether they are on track or not. If the testing lags, the team may explicitly change the scope or introduce additional testers. Agile Alliance stresses the ability to inspect and adapt continuously; therefore, the ratios between sprints are flexible according to the requirements.
In contrast, waterfall project managers might use more fixed-phase metrics (e.g., “requirements should be 15% of schedule”). They may also budget a “testing phase” chunk (often 20–30% at the end). But even in waterfall, good PM practice (as PMI advocates) is to track actual effort as you go, so if testing looks heavier than planned, you reallocate resources even late in the project.
Tracking & Adjusting in Practice
It is not enough to have target ratios; you need to measure and adjust. Time tracking and metrics are regularly important. Various teams note work against categories (e.g. development, testing, design, management, etc.) with the help of tools (JIRA, Trello, Asana, etc.). Atlassian advises teams to track their time by writing it down so that they can have priceless information on how they spend it. For example, perhaps you had planned 10% of the effort on the planning part, but if you are tracking and discover that you have spent 25% of that already, then that is an indication that you have to cut back somewhere or re-examine the scope.
Progress reports and dashboards are handy. It can display the number of tasks in Done vs Review/Test as a Kanban or sprint dashboard will. If the QA column has an increasing backlog, then it means that testers have become a bottleneck. The advice given by Atlassian is straightforward: with the help of real-time visibility (through boards and charts), it is possible to identify bottlenecks and pivot rapidly. An example is the Work Log reports or Tempo timesheets in Jira, allowing managers to view which projects or team members spend the most hours logged against each category. This assists in answering questions such as “Are developers using all their time to code, or are they firefighting bugs?”, and “Do we have sufficient QA bandwidth in this sprint?”.
The use of resources should also be explicitly discussed during regular retrospectives (in Agile) or post-milestone reviews (in waterfall). Question: Are we giving sufficient time to every role? Planned vs. actual. If the testers are invariably under-utilized, it is a possible sign that the code is too stable or the automation is too good; in this case, you could re-assign one of the testers to exploratory testing or user experience. When the developers are sitting around waiting on specs or fixes all the time, you may have overinvested in planning.
External benchmarks can also direct adjustments. When your team is way out of bounds (you spend 5% on testing) challenge it. Your situation should be approximated by some ratio in the literature (or even corporate history). On the other hand, if you are well above the standard (e.g., 50% testing), investigate why. It may be risk-based (e.g., medical software) or an indication of wastefulness. In the latter, you may consider the test automation, code reviews, or training to minimize rework.
Lastly, do not forget to optimize not only percentages but also outcomes. These guidelines aim to deliver high-quality software on time and within budget. If the set of features is small and you have some time to spare on QA, perhaps run more automated regression tests or better documentation. If PM overhead sneaks up (more than ~20%), possibly consider cutting back on meetings or giving team leads authority. Consider these ratios as a diagnosis tool: as Atlassian says, tracking will help you know, as they put it, which tasks and projects are the most demanding to do so that you can prioritize. Good project managers are also continually rebalancing: they do not necessarily follow a 25% test allocation to the letter if the numbers indicate that the code is too unreliable, and they do not allow devs to spend 90% of their time in meetings when features are not being shipped.
Synchronizing for Success — How the Right Mix Builds the Right Product
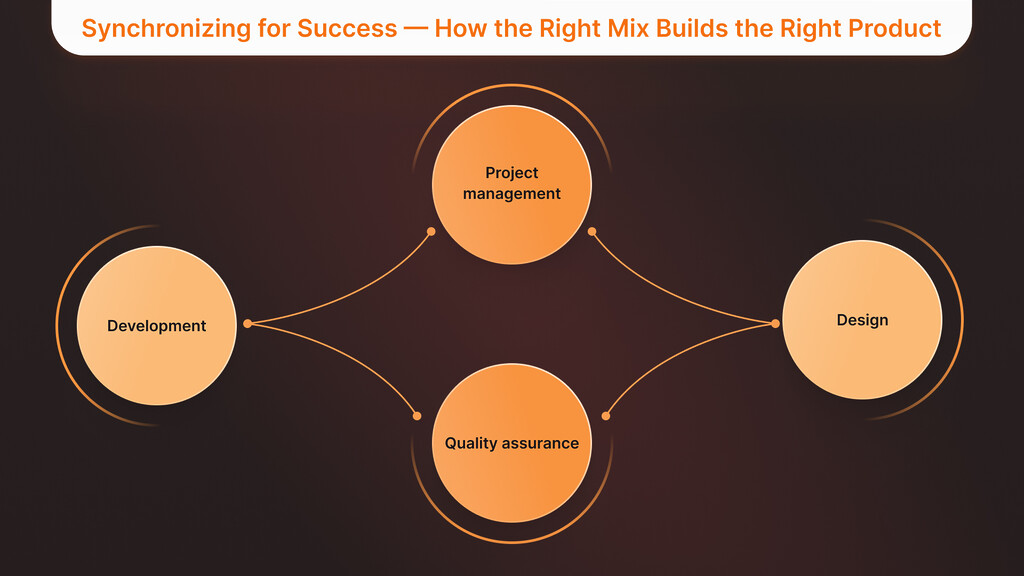
When the Dev, QA, Design, and PM are working in sync, it results in not just faster delivery but also better software. The balanced allocation maximizes the team’s efficiency and aligns business objectives with user expectations, decreasing technical debt and increasing innovation speed.
The advantages are not only metric-based. An easy-to-follow model of effort allocation instills predictability, transparency, and trust among all stakeholders, including C-suite leaders and developers. It provides the teams with a common structure upon which they can plan, adapt, and produce outstanding results.
The right allocation strategy is essential whether you are organizing an MVP, developing an enterprise platform, or modernizing an old piece of software.
Your business needs a development partner who knows that the number of code lines is just one of the ingredients of success. Should you want to develop or expand your web or backend solution, and wish to have the balance of the right team, reach out to us and speak to the right people to achieve your objectives.
Cutting-Edge Web Development for Competitive Advantage
Web Development Crafted to Fit Your Unique Business Requirements
Discover Web DevelopmentKey Takeaways
- Use ratios as a starting point, not gospel. A rule-of-thumb split (dev ~50%, QA ~25%, design/PM ~25%) helps plan, but adjust for your context.
- Consider project size and type. More complex or large projects usually require relatively more QA and PM; less complex projects can safely lean more towards coding.
- Methodology matters. In waterfall, you will have a large initial design/planning stage and an end testing stage. In Agile, we plan and test throughout every iteration, and bring roles (UX, QA) into every sprint team.
- Track actuals and act on them. Use time logs, burndown charts, or dashboards to see where time is really going. If testing is lagging, reassign resources or scope; if PM overhead is too high, streamline coordination.
- Leverage industry benchmarks. Surveys and experts (NN/g, PMI, etc.) offer data: e.g., typical design:dev ~1:10, tester:dev ~1:3–4, planning ~20%. Use these as sanity checks.
- Communicate and iterate. Communicate your plan of allocation with stakeholders (team, clients). Refer to it at milestones. Frequently, a little table or chart will clear the air on who is doing what percentage of the work.
Each team is unique, but those principles will assist you in proactively distributing effort instead of a reactive one. It is possible to strike the right balance where developers code, designers iterate, testers validate and managers orchestrate, all in a healthy balance, with a good baseline and constant monitoring.
What is software development effort allocation?
Software development effort allocation is the process of allocating time and resources across the development, quality, design, and project management phases to achieve quality, speed, and predictable delivery. It ensures teams avoid bottlenecks, reduces rework, and aligns technical implementation with business objectives.
What is the ideal dev QA design PM ratio in software projects?
One of the most widely agreed-upon ratios is: Dev 50-60%, QA 20-25%, Design 10-15%, and PM 10-20%. These ratios depend on project complexity, risk level, and delivery methodology, although they are widely used industry standards.
Why does development take the largest share of project effort?
Development is the most resource-intensive process, as it involves feature implementation, integrations, bug fixing, and unit testing. Despite robust planning and automation, building the real product is the most time-consuming task in software engineering.
How much time should be allocated to QA and testing in software development?
Most successful teams allocate 20-30% of their effort to QA and testing. Manual testing projects, regulatory projects, projects requiring high reliability, and teams with mature automation often demand more or slightly less, respectively.
How does project size affect effort allocation ratios?
QA and project management efforts tend to increase in size and complexity as projects grow. Bigger teams can invest more in coordination, integration testing, and risk management, while smaller projects or MVPs can afford to spend more time on development.
How does Agile vs. Waterfall affect effort allocation?
In Waterfall, most effort is concentrated at the beginning of requirements and design, followed by extensive testing. Agile uses a continuous design, development, testing, and planning process across sprints, providing a more balanced distribution of effort throughout the project lifecycle.
How do we track software development effort allocation effectively?
Team effort allocation is tracked using tools such as Jira, Tempo, or Asana and is classified as Dev, QA, Design, or PM. Dashboards, burndown charts, and time reports help compare actual versus planned effort, and bottlenecks can be easily identified before they escalate.
What happens if we allocate too little effort to QA or project management?
Underallocation of QA may also cause bugs in production and rework at high cost, whereas a lack of PM may cause scope creep, missed deadlines, and misalignment. The two problems generally increase the overall cost rather than reduce it.
Can developers handle QA instead of dedicated testers?
Unit and integration testing can be performed by developers, particularly in Agile teams; however, dedicated QA is essential to cover exploratory, usability, and compliance testing. This makes using developers for QA more risky due to blind spots.
Is there a best‑practice model for software project resource distribution?
No single model can be used, but industry standards (e.g., PMI, NN/g, COCOMO) provide useful starting points. The best teams use ratios as guidelines and adjust them based on risk, complexity, and actual performance data.
Should effort allocation stay fixed throughout a software project?
No. The distribution of effort should change with the project. A higher level of design and planning may be required in the initial stages, whereas a higher level of QA may be required in the later stages. Constant reevaluation and change will lead to improved outcomes.
How do we justify changing effort allocation to stakeholders?
Use metrics such as defect rates, velocity trends, missed deadlines, and industry standards. Balanced allocations are less risky to justify to business stakeholders when the risk reduction from rebalancing is demonstrated.