")
User Experience (UX) design is increasingly recognized as a critical factor in the success of technology businesses. UX can drive significant business outcomes by influencing key performance indicators (KPIs) such as conversion rates, customer satisfaction, and brand perception. This article provides a high-level overview of how UX affects business KPIs and explores the direct impact on conversion rates, revenue, customer satisfaction, and operational efficiency.
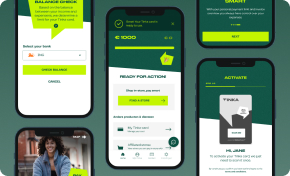
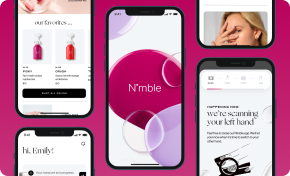
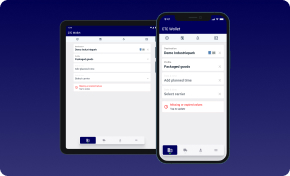
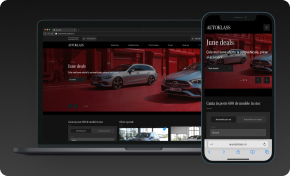
Design for Success with Stunning UX/UI From Our Team
Investing in UX Design Can Yield a Return of Up to $100 for Every $1 Spent
Discover UI/UX DesignOverview of UX-Related Statistics and Their Impact on Tech Business KPIs
- Conversion Rate Improvement: Strategic UX improvements can boost conversion rates by up to 400%.
- ROI of UX Investments: Every $1 invested in UX can yield a return of up to $100, translating to a 9,900% ROI.
- Revenue Impact of Poor UX: Slow-loading websites cost businesses up to $2 billion annually.
- User Retention: 88% of online consumers are less likely to return to a site after a poor user experience.
- Customer Satisfaction: About 74% of visitors are likely to return to mobile-friendly websites.
Impact of UX on Conversion Rates and Revenue
User Experience (UX) plays a pivotal role in shaping conversion rates and revenue generation for tech businesses. Here’s a deeper exploration of how strategic UX design can drive these critical business outcomes.
Conversion Rate Improvement
Direct Impact of UX Design on Conversion Rates
- 400% Conversion Rate Boost: Forrester’s research indicates that a well-executed UX design can raise conversion rates by up to 400%. By simplifying navigation and enhancing user flows, a strong UX reduces friction and encourages users to complete desired actions, whether it’s signing up for a service or making a purchase.
- Impact of UI Design: Effective UI design—through visual hierarchy, clear CTAs, and intuitive navigation—can increase conversion rates by up to 200%. A consistent, visually appealing interface builds user trust and ensures seamless browsing.
Case Studies
- Voices.com: By implementing strategic UX tactics like social proof, visitor segmentation, demonstration videos, and addressing customer objections, Voices.com achieved a 400% improvement in conversions.
- SAP BusinessObjects: After adding a more prominent CTA button, SAP BusinessObjects saw a 32% increase in conversions, showcasing how small UX changes can have a big impact.
- Moz: By redesigning their sign-up process based on UX principles, Moz increased conversions by 52% and generated over $1 million in additional revenue.
- Buyakilt.com: Adding product filters to their e-commerce site resulted in a 26% increase in conversions, demonstrating the effectiveness of UX changes in facilitating user decisions.
UX Design Elements Influencing Conversion Rates
- Visual Hierarchy and CTA Design: Strategic use of visual hierarchy, prominent CTAs, and attention-grabbing design can guide users’ attention toward key actions, improving engagement and conversions.
- Streamlined Forms and Reduced Friction: Reducing the number of fields in forms and simplifying layouts minimizes user effort, increasing form completion rates.
- Clear and Intuitive Navigation: Simplifying navigation structures helps users find information quickly, reducing bounce rates and increasing conversion likelihood.
- Persuasive Visual Design and Branding: Consistent, aesthetically pleasing design fosters trust and builds confidence, encouraging conversions.
Mobile Optimization
- With mobile traffic accounting for a significant portion of website visits, responsive and mobile-friendly UX design is vital.
- Approximately 74% of users are more likely to return to mobile-friendly sites, and 67% are more likely to make a purchase from such sites.
- Mobile optimization also reduces friction, as mobile users are five times more likely to abandon a task if the site isn’t optimized for mobile.
Performance Optimization
- Load Time Matters: A site that loads in one second has three times higher conversion rates than one that takes five seconds. Fast loading times, smooth transitions, and responsive interactions contribute to a seamless browsing experience, encouraging engagement and conversion.
Cutting-Edge Custom Software Development for Your Success
Create Software That Meets Your Specific Requirements
Explore Custom SoftwareRevenue Impact
ROI of UX Investments
- 9,900% ROI: Every $1 invested in UX can yield a return of $100, translating to a 9,900% ROI. This ROI is due to improved conversion rates, customer satisfaction, and reduced support costs.
Revenue Loss Due to Poor UX
- $2 Billion Lost Annually: Slow-loading websites, often a result of poor UX, cost businesses up to $2 billion annually in lost revenue.
- User Retention Impact: 88% of online consumers are less likely to return to a site after a bad experience. Investing in UX to improve user journeys reduces churn and leads to sustained revenue growth.
Real-World Examples Demonstrating Revenue Impact
- Amazon: The e-commerce giant saw a 1% increase in revenue for every 100ms reduction in page load time. This demonstrates the direct correlation between UX performance and revenue generation.
- Airbnb: Prioritizing UX from the outset helped Airbnb scale rapidly while minimizing support costs, contributing to their overall profitability and market success.
Strategic UX design significantly influences conversion rates and revenue. By optimizing user flows, reducing friction, and creating intuitive, responsive designs, companies can not only enhance user satisfaction but also drive substantial revenue growth. The business case for investing in UX is clear, as illustrated by both statistics and real-world success stories.
Impact of UX on Customer Satisfaction and Retention
User Experience (UX) directly shapes customer satisfaction and retention, which are critical to long-term business success. Here’s a more detailed exploration of how UX design can influence these key business metrics.
Customer Satisfaction
First Impressions and Credibility
- 94% Design-Related First Impressions: Nearly 94% of first impressions are design-related. A visually appealing, professional-looking website or application builds credibility and trust instantly, leading to increased engagement and loyalty.
- 75% Judge Credibility by Web Design: About 75% of users make judgments about a company’s credibility based on its website design. A poor visual design can deter potential customers, while a well-designed UX fosters trust and satisfaction.
Mobile Optimization and User Expectations
- Mobile-Friendly Impact: Approximately 74% of people are more likely to return to mobile-friendly sites, and 67% are more likely to purchase a product or service from such sites. With mobile traffic continuing to grow, optimizing UX for mobile is crucial.
- Personalization Demand: Around 70% of Gen Z users expect websites to know what they want intuitively. Personalized and predictive experiences lead to higher satisfaction and can differentiate a brand from its competitors.
Tailored Mobile Solutions for Your Unique Needs
Redefine Your Business with Mobile Application Development
Explore Mobile App DevelopmentPersonalized Experiences and Engagement
- Customized Content: Personalized content and recommendations make users feel valued and understood, directly impacting satisfaction levels. Engaged and satisfied users are more likely to become loyal customers.
- Predictive UX: UX designs that anticipate user needs and provide relevant suggestions help reduce decision fatigue and create a smoother journey, improving overall satisfaction.
Continuous Customer Feedback Loop
- User-Centered Design: Brands that actively seek and incorporate user feedback into their UX design foster stronger customer relationships. This user-centered approach ensures that the product meets user expectations and improves satisfaction.
- Usability Testing and Improvements: Regular usability testing identifies pain points and opportunities for enhancement, leading to continuous UX improvements and higher satisfaction rates.
Customer Retention
Negative Experiences and User Return
- 88% Won’t Return After Poor Experience: A staggering 88% of online consumers are less likely to return to a website after a bad user experience. Ensuring a seamless, intuitive journey is crucial for retaining customers.
- 79% Abandon Due to Performance Issues: Around 79% of users who experience performance issues, like slow-loading pages, won’t return. Fast loading times and smooth interactions are essential for retention.
Retention and Profitability Correlation
- 5% Retention Increase = 25% Profit Boost: Improving customer retention by just 5% can increase profitability by up to 25%. Loyal customers are more likely to make repeat purchases and refer others, driving revenue.
- Continuous Engagement Metrics:
- Companies focusing on improving customer experience see a 42% improvement in retention, a 33% improvement in satisfaction, and a 32% increase in cross-selling and up-selling.
Speed and Convenience
- One-Second Load Time Advantage: Sites that load in one second have three times higher conversion rates than those taking five seconds. Faster load times reduce frustration and improve retention.
- Task Completion Rates: Mobile users are five times more likely to abandon a task if the site isn’t optimized for mobile. Streamlining mobile UX enhances task completion rates and boosts retention.
Self-Service and Support
- Proactive Self-Service UX: Designing intuitive self-service features reduces the need for customer support, improving the overall experience and reducing churn.
- Support Reduction: Effective UX design that addresses common user pain points upfront reduces support calls and enhances customer retention by improving satisfaction.
Case Studies and Examples
- Bank of America: By redesigning their online banking enrollment process, Bank of America doubled the percentage of customers completing the process, improving user satisfaction and reducing churn.
- Amazon: Amazon’s focus on user-friendly navigation, personalized recommendations, and fast loading times has resulted in high customer retention rates.
The impact of UX on customer satisfaction and retention is undeniable. By focusing on creating seamless, personalized experiences and reducing friction points, businesses can significantly improve user satisfaction and foster loyalty. Investing in UX design leads to long-term customer relationships, higher retention rates, and sustainable revenue growth.
Impact of UX on Brand Perception
User Experience (UX) is instrumental in shaping how consumers perceive a brand. This section provides a comprehensive exploration of how strategic UX design influences brand perception, trust, emotional connection, and loyalty.
Building Trust and Credibility
Security and Trust
- Security Features in UX Design: Prioritizing security within UX design, such as implementing secure login processes and transparent privacy policies, enhances user trust.
- User Communication: Clearly communicating security measures and privacy practices through the UI increases users’ sense of safety and reliability.
Consistency Across Platforms
- Cross-Platform Brand Identity: Consistent UX design across platforms reinforces brand identity, allowing users to recognize and trust the brand whether they’re interacting through a website, mobile app, or other channels.
- Unified Design Language: A unified design language across digital touchpoints ensures that users receive a consistent message, improving brand recall and trust.
Enhancing Emotional Connection
Emotional Design
- Visual Elements and Emotions: Specific design elements, such as color, typography, and imagery, evoke emotions that create a deeper connection between the user and the brand.
- Mood and Tone: The overall mood and tone conveyed by the UX design can influence user emotions, making the brand feel approachable, innovative, or trustworthy.
Personalization and Engagement
- Customized User Experience: Personalization makes users feel valued and understood, strengthening emotional ties with the brand.
- Interactive Features and Gamification: Engaging UX/UI design elements, such as interactive features, quizzes, and gamification, can transform casual users into brand advocates.
Storytelling through Design
- Brand Narrative via UX/UI: Storytelling through UX/UI design allows brands to visually communicate their narrative and values, leading to stronger emotional connections.
- Consistent Brand Messaging: Consistent messaging through design elements like imagery, tone, and icons aligns user perception with the brand’s intended narrative.
Fostering Brand Loyalty and Advocacy
User-Centered Design
- Research and Feedback Integration: Brands that prioritize user research and actively incorporate feedback into their UX design are better positioned to create products tailored to their audience’s needs.
- Continuous Improvement: A focus on continuous improvement through usability testing and A/B testing builds a user-centered product that drives brand loyalty.
Ease of Use
- Intuitive UI and Streamlined UX: Intuitive UI and streamlined UX make users feel comfortable and confident when interacting with a brand. Confusing navigation or difficult forms can frustrate users and damage brand perception.
- Effortless Navigation: Effortless navigation and clear information architecture ensure users can easily find what they need, leading to positive brand experiences.
Transparency and Honesty
- Transparent Policies and Pricing: Transparent policies, pricing, and terms create a sense of honesty and reliability. Conveying this information clearly and effectively through the UI enhances brand perception.
- Open Communication: Providing proactive information about updates, changes, and errors strengthens user trust and brand advocacy.
Case Studies and Examples
- Airbnb: Airbnb’s consistent design language across platforms, focus on personalization, and transparent policies have made it one of the most trusted travel brands globally.
- Spotify: Spotify’s personalized playlists and easy-to-use interface create an emotional connection with users, fostering strong brand loyalty.
A strategic focus on User Experience (UX) plays a pivotal role in shaping brand perception. By building trust, enhancing emotional connections, and fostering loyalty, companies can position themselves as trusted and reliable brands. Investing in UX design is an essential strategy for creating a positive brand image, building lasting relationships, and cultivating brand advocates.
Impact of UX on Reduced Development and Support Costs
Investing in User Experience (UX) not only enhances user satisfaction and engagement but also significantly reduces development and support costs. Here’s a detailed exploration of how effective UX practices contribute to these cost reductions.
Reduced Development Costs
Early Error Detection
- 100x Cheaper to Fix Errors in Design Phase: Issues identified during the design phase are up to 100 times cheaper to resolve than those found post-release. By integrating UX research and testing early, businesses can identify usability issues before they escalate, saving substantial costs.
- IBM Case Study: IBM found that investing in early-stage UX led to cost reductions by catching design flaws that would have been more expensive to fix in later stages.
Decreased Time-to-Market
- 50% Reduction in Time-to-Market: Nielsen Norman Group research shows that effective UX design can reduce the product development cycle by 33-50%. A streamlined UX process minimizes costly revisions and ensures the product meets user expectations, speeding up time-to-market.
- Clear Requirements Definition: Well-documented UX requirements prevent scope creep and reduce the need for redesigns, accelerating the development process.
Minimized Rework
- 50% Reduction in Rework Time: Massachusetts Innovation and Technology Exchange notes that UX design can save up to 50% of development rework time by clearly defining requirements upfront. Early user testing and iterative prototyping reduce the risk of significant changes during development.
Real-World Examples
- General Electric: After investing in a unified UX for its software platforms, General Electric reported a 100% productivity gain in development teams and saved an estimated $30 million in the first year alone.
- Bank of America: Redesigning their online banking enrollment process based on UX principles led to significant reductions in development rework and increased customer completions.
Reduced Support Costs
Lower Support Calls
- Proactive UX Design Reduces Support Calls: Effective UX design addresses potential user issues before they become problems, leading to a decrease in support calls.
- Zendesk Case Study: Companies investing in proactive UX design saw a 20% reduction in support requests due to intuitive interfaces and clear self-service information.
Enhanced Self-Service Capabilities
- Intuitive Design Enables Self-Service: By improving the intuitiveness of a product, users are more likely to resolve issues on their own without contacting support.
- Forrester Study: A Forrester study highlighted that companies investing in UX see reduced support costs due to enhanced self-service capabilities.
Error Minimization
- Preventing User Errors through UX: Strong UX designs prevent extensive support requirements by reducing user errors. Robust frameworks ensure that users can easily navigate the product without making costly mistakes.
- Microsoft Study: Microsoft observed that incorporating user-centered design principles reduced the need for customer support interventions by 30%.
Case Studies and Examples:
- General Electric: By redesigning their internal software UX, General Electric reduced customer support requests significantly, saving millions in support costs.
- Amazon and Airbnb: Both companies have heavily invested in UX from their inception, focusing on user-friendly designs that minimize the need for customer support. This proactive approach has contributed significantly to their operational efficiency.
Investing in UX design is not just about enhancing user satisfaction and brand perception. By incorporating UX practices early in the development process and creating intuitive, user-centered interfaces, companies can significantly reduce both development and support costs. Early error detection, reduced rework, and lower support calls contribute to higher operational efficiency, making UX investment a financially sound strategy.
Redefine Your IT Strategy with Our Consultancy
Customized Solutions for Optimal Performance
Discover IT ConsultingInvesting in User Experience (UX) directly impacts tech business KPIs
The business impact of User Experience (UX) is clear: strategic UX design drives conversion rates, customer satisfaction, brand perception, and reduces development and support costs. By prioritizing a user-centered approach, companies can achieve significant ROI, foster loyalty, and streamline their operations.
Ready to transform your digital experience and see tangible business results? Contact HyperSense today to discover how our expert UX design solutions can elevate your brand and enhance customer satisfaction.