In the tech-driven world, where software reliability and efficiency are paramount, mastering the art of log management is crucial. AWS CloudWatch emerges as a pivotal tool, transforming the mundane task of logging into a strategic asset for developers and IT professionals. This guide explores the intricate process of leveraging CloudWatch for log acquisition and utilization, offering practical insights for tech enthusiasts and professionals alike. From parsing the complexities of what data to log, to navigating the nuances of log retention and structure, we delve into how CloudWatch can optimize your application’s performance and troubleshooting capabilities.
For those interested in broadening their AWS knowledge, HyperSense’s insightful article on AWS Athena and log parsing offers complementary insights here.
Acquiring Logs with AWS CloudWatch
In the quest for optimal software performance and issue resolution, acquiring comprehensive logs is the first critical step. AWS CloudWatch, renowned for its versatility, stands as a formidable choice for this task. Let’s break down the essentials of log acquisition using CloudWatch.
1. Embracing Diversity in Log Sources
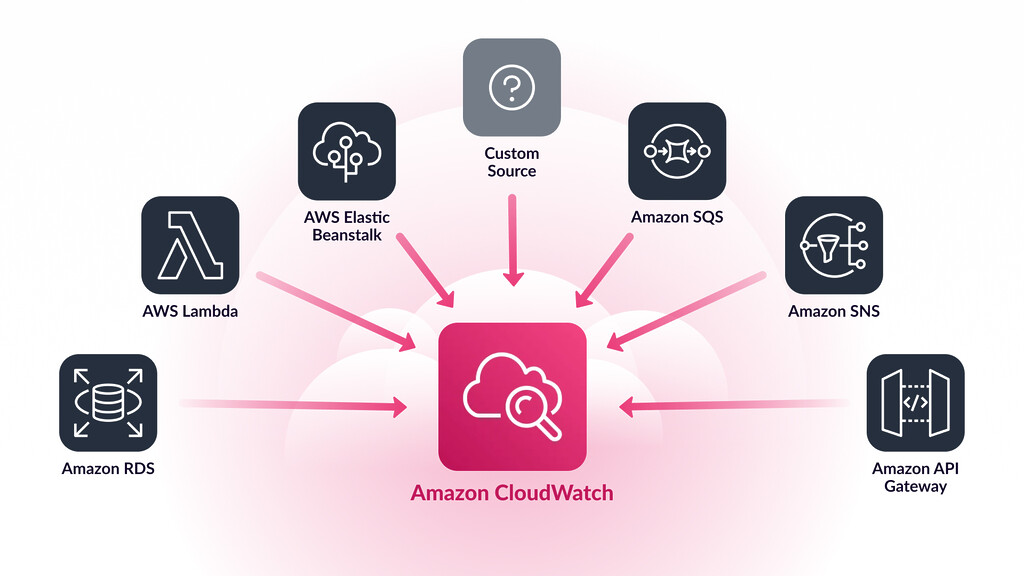
CloudWatch is not just a tool; it’s a canvas that accommodates a wide spectrum of log sources, ensuring no vital data slips through the cracks. It seamlessly integrates with:
- Lambda functions
- Beanstalk
- API Gateway
- SNS (Simple Notification Service)
- SES (Simple Email Service)
- Custom sources
This integration flexibility is a game-changer, enabling developers to capture logs from varied environments, ensuring a holistic view of their application’s health.
Begin Your Digital Transformation Journey
Customized Strategies to Lead Your Business into the Digital Age
Explore Digital Transformation2. Navigating the Maze of Log Management
Effective log management with CloudWatch hinges on addressing three core questions:
a. Deciding What to Log
This question is a balancing act between capturing enough details for troubleshooting and respecting privacy concerns. The best practice is to log identifiers (IDs) rather than personal data, and to avoid logging sensitive keys and tokens. This approach not only enhances security but also aligns with GDPR requirements.
b. Determining Log Retention Duration
The retention period for logs can vary based on application needs and regulatory compliance. Shorter retention helps in managing costs and aligning with GDPR, while longer retention is beneficial for in-depth historical analysis.
IT Consultancy for Strategic Advantage
Tailored IT Solutions to Drive Your Business Forward
Discover IT Consultingc. Structuring Logs for Clarity
The log structure should facilitate easy navigation back to the specific code that generated it. This involves using keywords and structured data formats. Implementing different log levels such as log, warn, and error aids in categorizing issues and streamlining the debugging process.
In the next section, we’ll dive into how to harness these logs to their full potential, making them more than just data – but a roadmap to enhanced application performance and stability.
Using the Logs Effectively
Transforming logs into actionable insights is a crucial phase in log management. This process involves various strategies, from basic analysis to advanced pattern recognition, making raw data a valuable asset for system diagnosis and enhancement.
Debugging: Decoding System Anomalies
Logs become indispensable when systems behave unexpectedly. CloudWatch’s robust search functionalities include date filters and a search bar, enabling quick navigation to the incident’s timeframe. Its support for regex (regular expressions) adds precision to this process:
- Basic keyword search for pinpointing specific events.
- Regex capability (
regex) for detailed pattern searching.
For regex searches, a handy tool to build and test your expressions is regex101.com, which provides a user-friendly platform for crafting and testing regex patterns before implementing them in CloudWatch.
Pattern Matching: Zeroing in on Key Events
CloudWatch’s pattern matching is essential for filtering logs based on specific criteria. It’s particularly useful for isolating logs with pre-defined keywords or patterns:
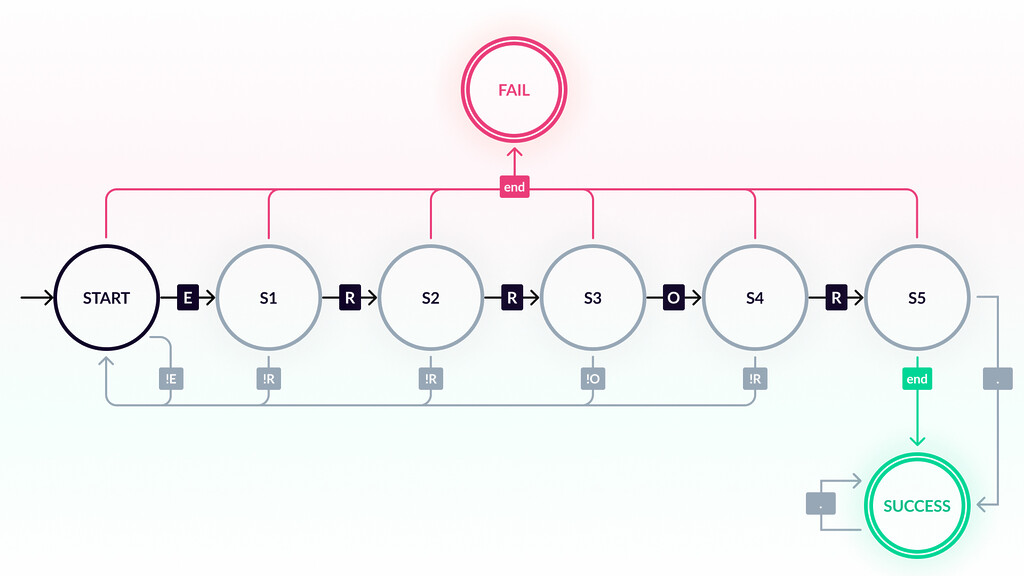
- Filter logs where the 3rd word is “ERROR” with a pattern like
[w0, w1, w2=ERROR, w3]. - Identify the start of a lambda call with patterns like
[w1=INIT_START,w2]. - Track the end of a lambda function using
[w1=REPORT,w2]. - Combine patterns using the
||operator (e.g.,[w0, w1, w2=ERROR || w2=WARN, w3]) to list both errors and warnings.
Regex Filters: Unleashing Advanced Search Capabilities
Regex filters elevate log analysis, enabling complex pattern searches and detailed data sifting:
- Regexes can search for keywords, patterns, or specific orders.
- CloudWatch-specific syntax requires wrapping regex patterns in
%, like%^INIT_START|REPORT.*%.
Essential Regex Patterns for CloudWatch
Understanding basic regex patterns can drastically improve log analysis efficiency in CloudWatch:
^(starts with),$(ends with),.(any character),?(optional),|(or),[a-z](any lowercase letter),[0-9](any digit),*(any number of times),+(at least once).
Applying these regex patterns effectively reduces time spent on log analysis, leading to quicker issue identification and enhanced system monitoring.
In the next section, we will delve into transforming these logs into proactive monitoring tools, enabling real-time insights and quicker responses to system irregularities.
Monitoring and Metrics: Elevating Log Analysis
Beyond mere data collection, the true potential of logs lies in their ability to drive proactive system monitoring and issue detection. AWS CloudWatch elevates this process through advanced metrics and monitoring capabilities.
Metrics: Turning Logs into Proactive Alerts
Metrics in CloudWatch aren’t just about counting log entries; they’re about deriving actionable insights from them. Custom metrics can be created to focus on specific log types, like ERROR or WARNING codes, enabling a more targeted approach to system monitoring:
- Utilize custom metrics to track and alert on specific log types.
- Assign weights to different events for nuanced monitoring.
However, it’s important to note that:
- Metrics calculations begin from the time of their creation, not from the start of the logs.
- There may be some delay in event capture and metric calculation.
Web Development for a Strong Digital Foundation
Build a Robust Online Platform with Our Expertise
Discover Web DevelopmentLambda: Unleashing Unlimited Log Processing Potential
The integration of CloudWatch logs with AWS Lambda opens a realm of unlimited processing possibilities. This setup allows for complex log analysis and automated responses based on log content:
- Process logs with Lambda for custom analysis and response actions.
- Automate notifications, emails, or other actions based on log content.
Utilizing CloudWatch’s Full Spectrum of Capabilities
CloudWatch’s strength lies in its simplicity and versatility. At a glance, it’s a straightforward tool, but its true power is in its adaptability to various scenarios and needs. This versatility makes it an invaluable asset for monitoring servers, applications, APIs, and aiding in powerful debugging tasks. By enabling efficient data processing through features like regex filtering, CloudWatch stands out as a comprehensive solution for managing and utilizing logs.
In the next part, we’ll conclude by emphasizing the significance of CloudWatch in the broader context of software development and IT infrastructure management, highlighting its role in enhancing application performance and stability.
Conclusion: Harnessing CloudWatch for Enhanced Software Management
As we’ve explored, AWS CloudWatch is more than a log storage service; it’s a powerful, versatile tool that plays a critical role in modern software development and IT infrastructure management. Its ability to adapt to various scenarios, from simple log storage to complex pattern recognition and proactive monitoring, makes it invaluable for developers and IT professionals alike.
The Power of Simplicity and Flexibility
CloudWatch’s simplicity is deceptive; behind its user-friendly interface lies a robust set of features that cater to diverse needs. This simplicity, coupled with its flexibility, allows CloudWatch to seamlessly integrate into various workflows, making it a go-to solution for organizations of all sizes.
Design for Success with Stunning UX/UI From Our Team
Investing in UX Design Can Yield a Return of Up to $100 for Every $1 Spent
Discover UI/UX DesignTurning Data into Insights
CloudWatch’s real strength lies in its ability to turn raw log data into actionable insights. Whether it’s debugging an unexpected issue, monitoring system health in real-time, or automating responses to specific log patterns, CloudWatch provides the tools necessary to make informed decisions quickly.
A Catalyst for Reliable and Efficient Applications
By leveraging the full potential of CloudWatch, developers and IT teams can ensure their applications are not only running efficiently but also proactively managed for any potential issues. This leads to more reliable, stable, and user-friendly applications, which is paramount in today’s technology-driven landscape.
Looking Ahead
As technology continues to evolve, tools like CloudWatch will become even more integral to software development and IT infrastructure management. Embracing its capabilities today will prepare teams and organizations for the challenges and opportunities of tomorrow’s tech environment.
In conclusion, AWS CloudWatch is a key player in the realm of log management. Its ability to provide detailed insights, coupled with its ease of use, makes it an essential tool for any tech professional looking to enhance application performance and stability. By understanding and utilizing CloudWatch to its full potential, we can not only solve current issues but also anticipate and prevent future challenges, paving the way for more innovative and robust software solutions.
Want to dive deeper into AWS CloudWatch and other cutting-edge technologies? We’re here to help. Visit our contact page to get in touch with our experts for tailored advice and solutions. And don’t miss out on the latest insights and updates from the world of tech—subscribe to our newsletter today for regular, informative content that keeps you ahead of the curve. Join the HyperSense community and stay at the forefront of technology!